Every number has a source
An iPhone kidney diet tracker for potassium, phosphorus, sodium, protein and fluid. Each value shows the record it came from.
Search and barcode scanning are free. Tracking costs $39.99 a year after a 7‑day free trial.
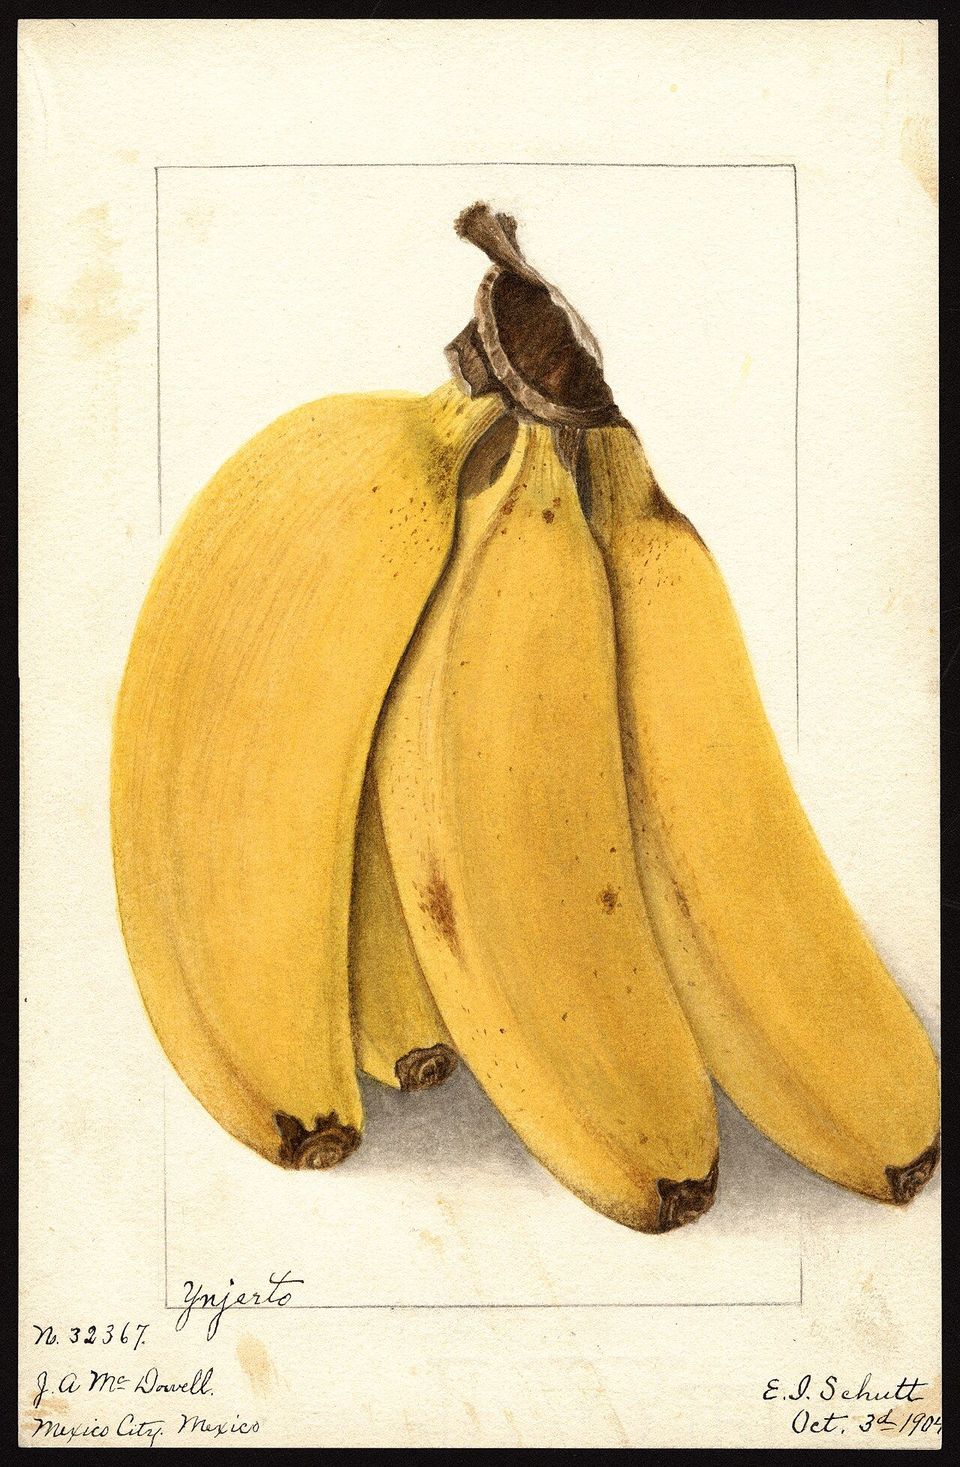
Try the food lookup
Bananas, raw
Source: USDA FDC #173944 (SR Legacy)
In 118 g
| Potassium | 422 mg |
|---|---|
| Phosphorus | 26 mg |
| Sodium | 1 mg |
| Protein | 1.3 g |
| Calories | 105 kcal |
| Fluid | Not a liquid |
Not medical advice. Numbers are for the food as described in the data source.
These are 59 of the app’s 13,694 foods. Try , or .
Missing is not zero
A blank on a food label is easy to read as 0 mg. Kidney Compass shows it as Unknown.
In the USDA packaged-food data built into the app, 421,981 of 434,111 products give no phosphorus value, and 222,014 give no potassium. When you need a number anyway, you can borrow one from a similar USDA food; it stays marked ESTIMATED.
Scan
Flaky layers biscuits
Packaged food, 1 biscuit (34 g)
Source: USDA FDC #1608518 (Branded)
Phosphorus: USDA FDC #172669 (SR Legacy)
Phosphorus additive
Found in ingredients: sodium acid pyrophosphate.
Potassium chloride / salt substitute
Found in ingredients: potassium chloride.
In 34 g
| Potassium | Unknown |
|---|---|
| Phosphorus | 152 mgESTIMATED |
| Sodium | 300 mg |
| Protein | 2.0 g |
| Calories | 100 kcal |
Potassium is not on this label
You can borrow the value from a similar USDA food. It will be clearly marked as an estimate.
Estimate potassium from a similar USDA foodA real record from the app’s barcode data. The phosphorus estimate is borrowed from “Biscuits, plain or buttermilk, refrigerated dough, higher fat, baked”.
Scan for phosphate additives
Point the camera at a barcode. The app checks 434,111 USDA products stored on the phone, then Open Food Facts when you’re online, and reads the ingredients for phosphate additives and potassium salt substitutes.
Added phosphate is absorbed more easily than the phosphorus in whole foods, and US food labels don’t have to list phosphorus at all. Any ingredient with “phos” in its name gets a warning.
- Monocalcium phosphate19,517
- Sodium phosphate17,602
- Sodium acid pyrophosphate16,514
- Sodium aluminum phosphate8,466
- Potassium chloride7,798
- Disodium phosphate6,720
- Phosphoric acid5,416
- Dipotassium phosphate4,928
86,096 products carry at least one phosphate additive. Potassium chloride is the salt substitute.
Your day against your limits
Enter the limits your care team gives you. Each meal you log draws down potassium, phosphorus, sodium, protein and fluid.
The app also lists foods whose usual portion still fits your remaining potassium, phosphorus and sodium. Soups, ice cream and drinks you log can count toward fluid.
Sample day with example limits. Yours come from your care team.
Tuesday, October 27
Today
Foods that fit what’s left
- Cranberries, raw1 cup, whole80 mg
- Cucumber, with peel, raw0.5 cup slices76 mg
- Rice, white, long-grain, cooked1 cup55 mg
- Lettuce, iceberg, raw1 cup shredded102 mg
Potassium per portion. Each also keeps phosphorus under 190 mg.
Potassium, fruit by fruit
Between 1886 and 1942 the USDA paid artists to paint new fruit varieties, about 7,500 sheets in all. The same department now publishes these potassium figures, each for a usual portion.
-
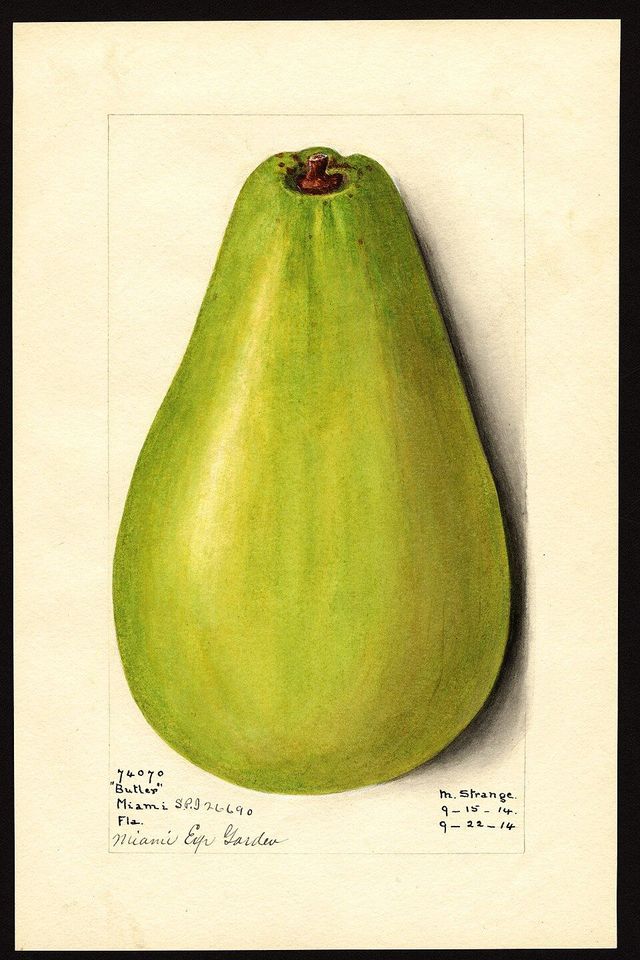
Avocado
728 mg in 1 cup, cubes
M. Strange, 1914
-
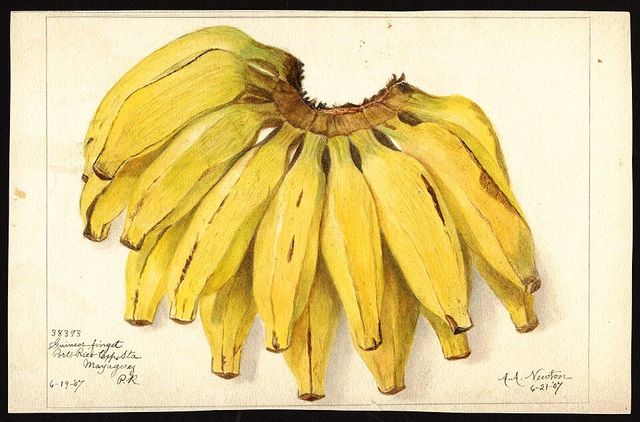
Banana
422 mg in 1 medium
Amanda Almira Newton, 1907
-
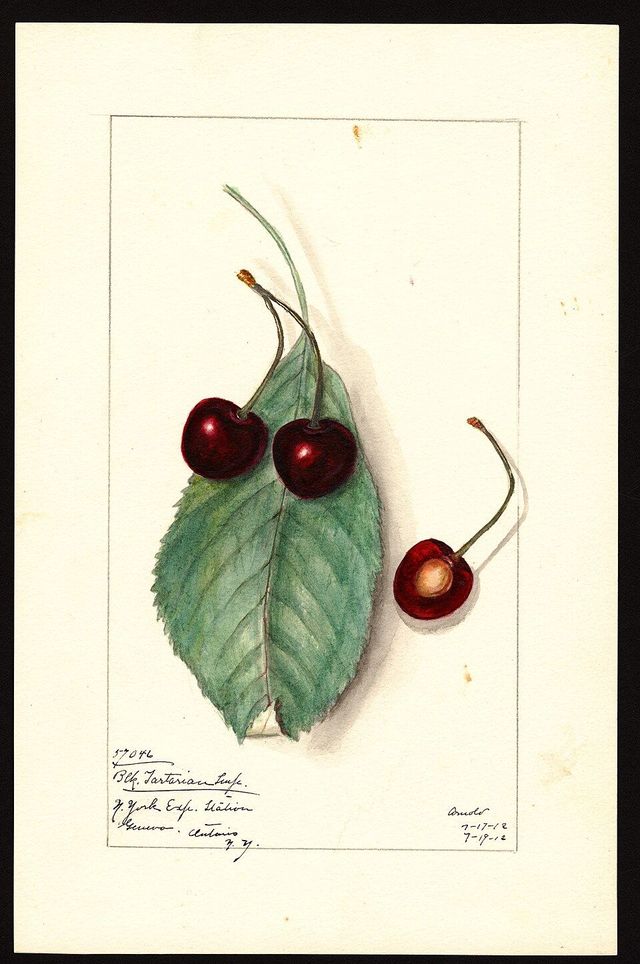
Sweet cherries
342 mg in 1 cup, without pits
Mary Daisy Arnold, 1912
-
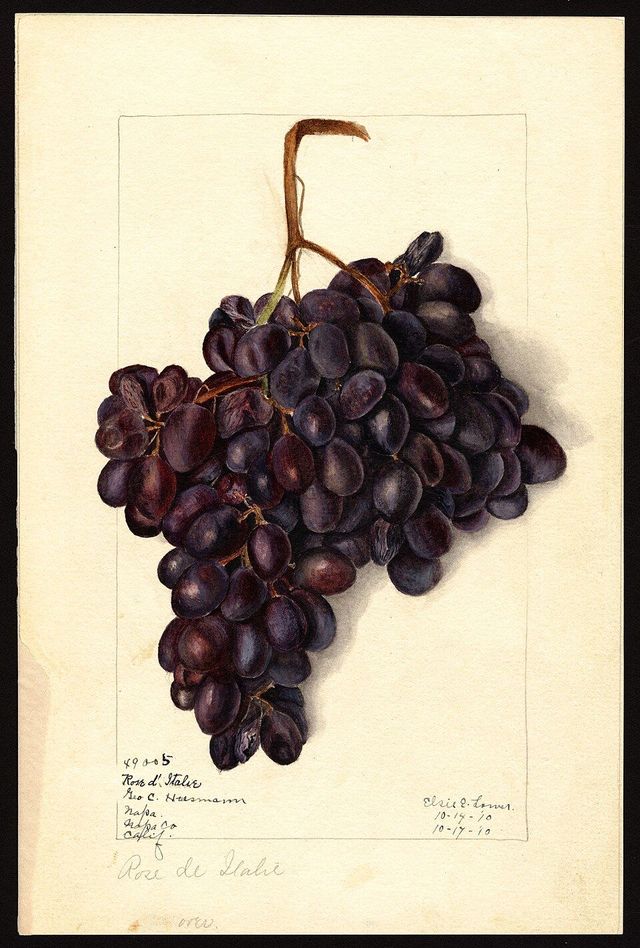
Grapes
288 mg in 1 cup
Elsie Lower Pomeroy, 1910
-
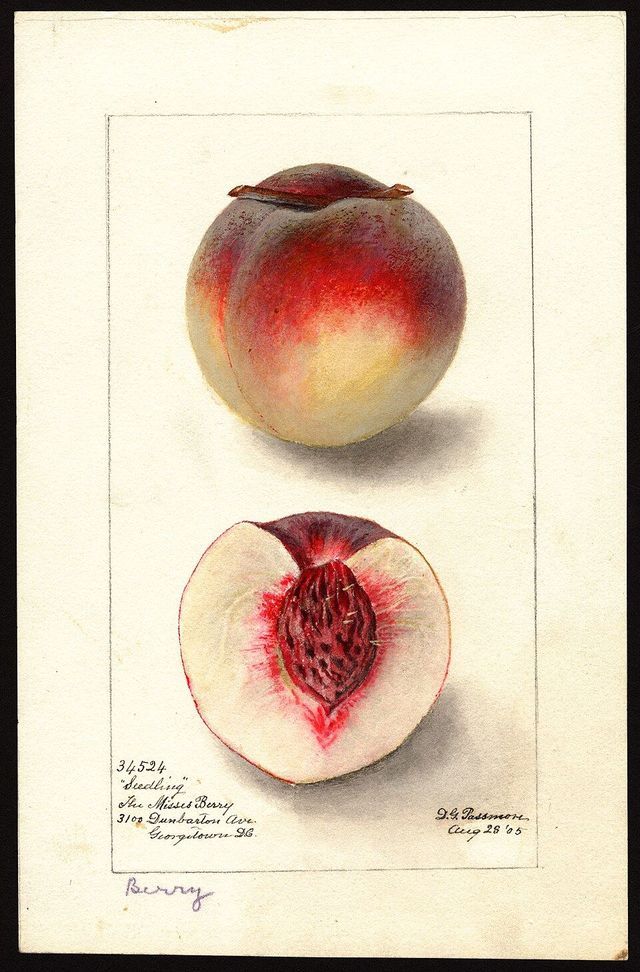
Peach
285 mg in 1 medium
Deborah Griscom Passmore, 1905
-
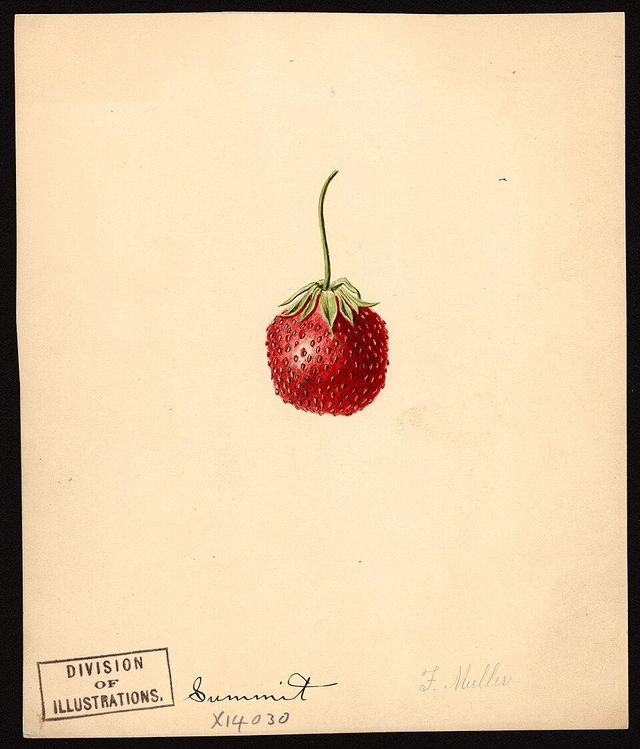
Strawberries
233 mg in 1 cup, halves
Frank Muller, 1891
-
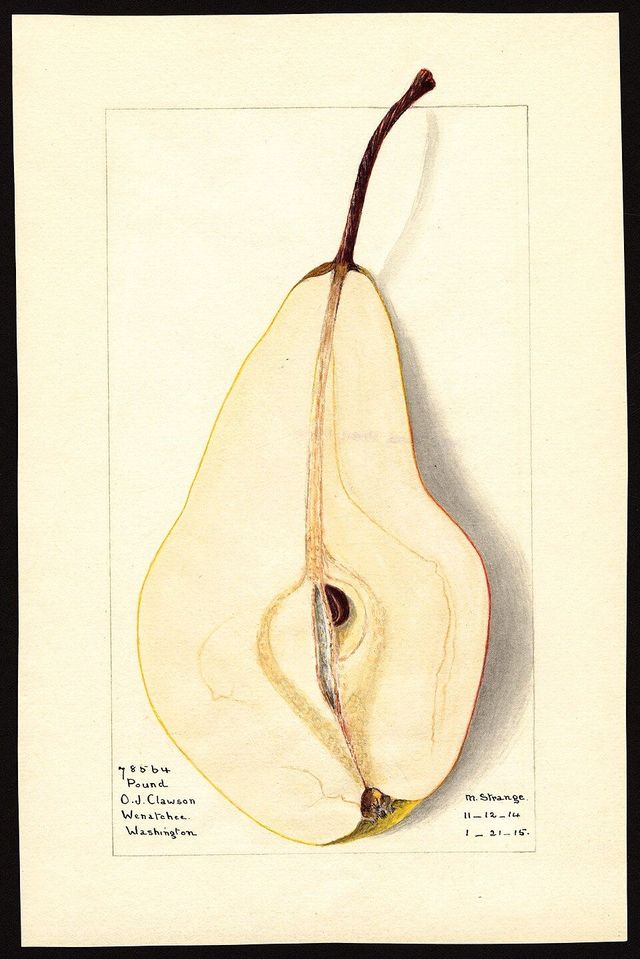
Pear
206 mg in 1 medium
M. Strange, 1915
-
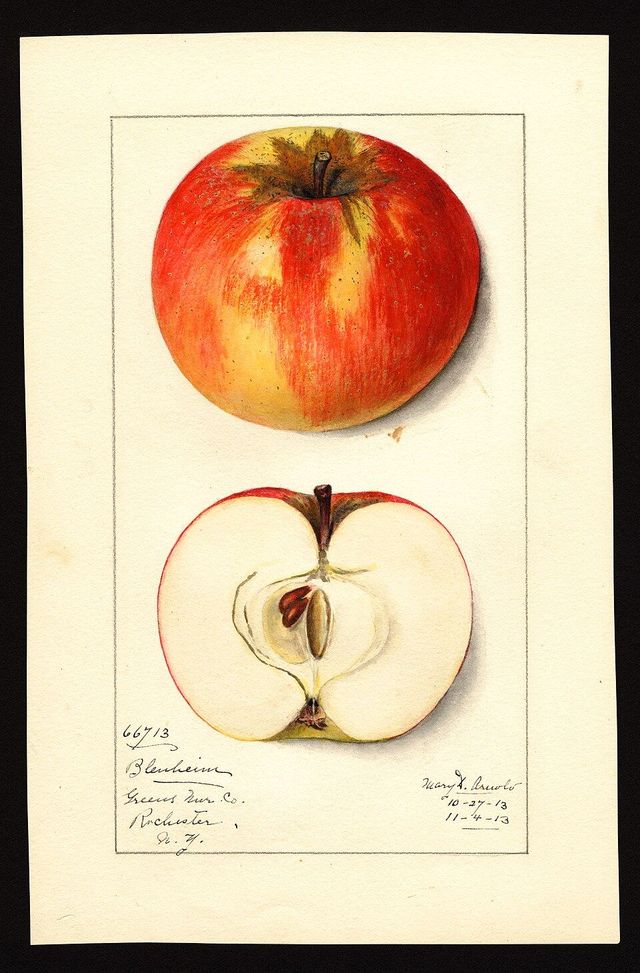
Apple
195 mg in 1 medium
Mary Daisy Arnold, 1913
-
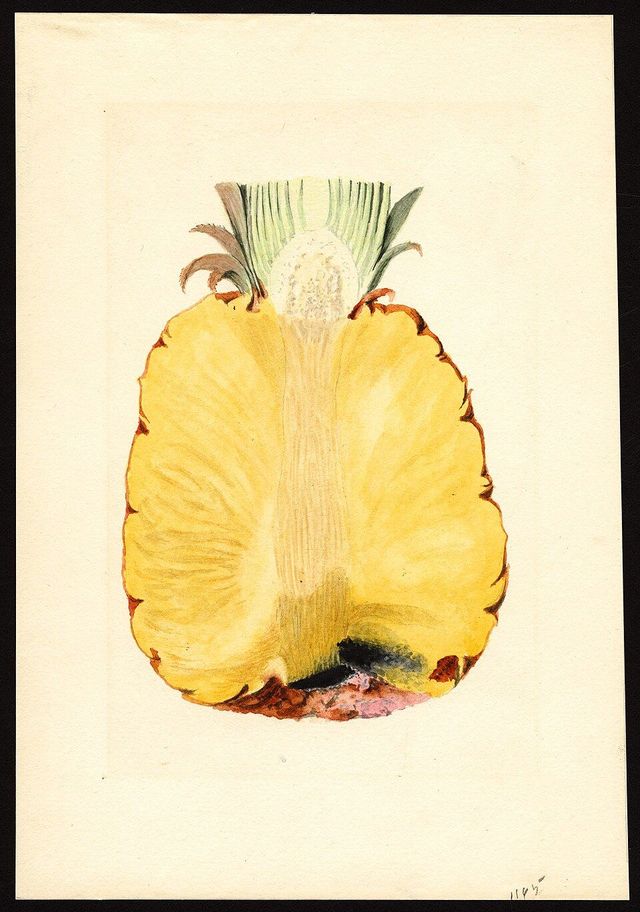
Pineapple
180 mg in 1 cup, chunks
James Marion Shull, 1919
-
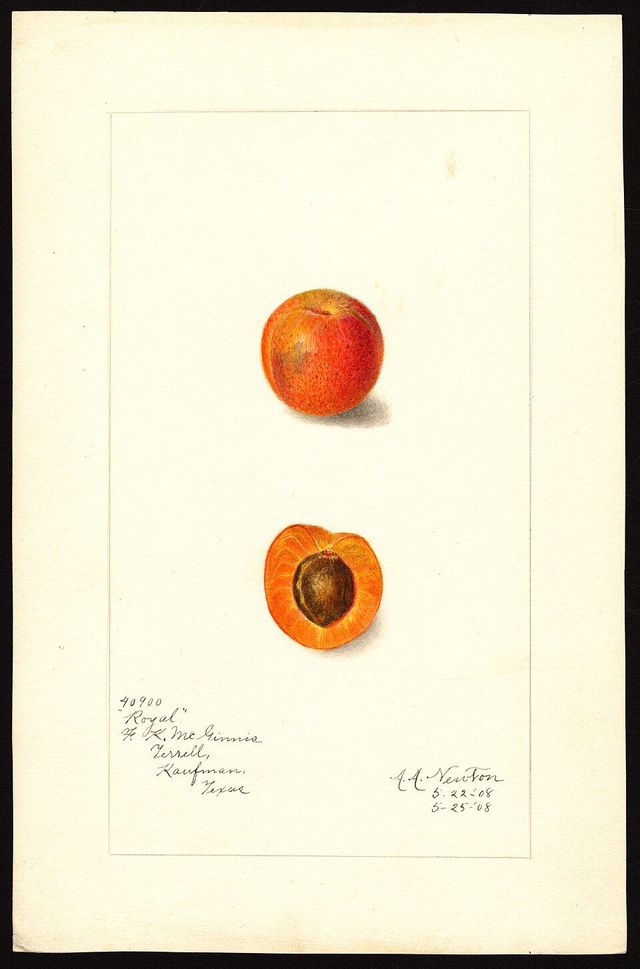
Apricot
91 mg in 1 apricot
Amanda Almira Newton, 1908
Check the portion. One apricot has 91 mg of potassium; a cup of apricot halves has 401 mg.
Weekly report
| Nutrient | Average | Limit | Days over |
|---|---|---|---|
| Potassium | 1,710 mg | 2,000 mg | 1 |
| Phosphorus | 690 mg | 800 mg | 0 |
| Sodium | 1,540 mg | 2,000 mg | 0 |
| Protein | 55.1 g | 60.0 g | 2 |
| Fluid | 870 mL | 1,000 mL | 1 |
Top potassium foods
- Potatoes, baked2,777 mg
- Orange juice, raw1,488 mg
- Milk, reduced fat, 2%1,025 mg
Potassium, blood (mmol/L)
Not medical advice. Values come from USDA FoodData Central and the user’s own entries.
The weekly report
Before an appointment, send your renal dietitian a PDF of your week.
It shows your daily averages against your limits, the foods that brought the most potassium and phosphorus, and your lab trends. Log eGFR, creatinine, potassium, phosphorus, sodium, albumin, BUN or any test you add, in US or SI units.
Sample report with made-up values.
No account to make
Your log, labs and limits stay on your iPhone. Back everything up to a file whenever you like; that part is free too.
What does leave the phone
- Unknown barcodes
- When a barcode isn’t in the built-in USDA data, the app sends just that number to Open Food Facts to look it up.
- Purchases
- Apple handles payment. RevenueCat checks your subscription with an anonymous ID and never sees your food or health data.
- Crash reports
- If the app crashes, it may send the device model, iOS version, app version and the error. Food names, nutrient values and lab results are left out.
Large type, big buttons
Text starts larger than the iOS default and grows with your text-size setting. Buttons are at least 52 points tall, and VoiceOver reads every value, including whether it’s an estimate.
Potassium422 mg
Potassium422 mg
Potassium422 mg
Free to look up, paid to track
Free
- Food search with household portions
- Barcode scanning
- Warnings for phosphate additives and potassium salt substitutes
- The source behind every value
- Backup to a file
Premium
- Meal log with favorites, recents and “copy the day before”
- Daily budget for potassium, phosphorus, sodium, protein and fluid
- Foods that fit what’s left
- Fluid tracker with quick-add buttons
- Lab log with trend charts
- Weekly PDF report for your dietitian
- Recipes, and your own foods from labels
| Yearly | $39.99 a year | 7-day free trial |
|---|---|---|
| Monthly | $6.99 a month | |
| Lifetime | $99.99 once | No renewal |
Prices in US dollars; the App Store shows yours. Subscriptions renew automatically unless you cancel in iPhone Settings at least 24 hours before the period ends.
Questions
Something else? Write to support. Data corrections are welcome.
Where do the numbers come from?
Whole foods come from USDA FoodData Central (Foundation, SR Legacy and FNDDS). Packaged foods come from USDA’s Branded Foods data, and from Open Food Facts for barcodes the USDA doesn’t have. Every value names its record, for example “USDA FDC #173944 (SR Legacy)”.
Why does a value say Unknown?
Because the source has no value for it. The app never fills a gap with zero, and a day’s total that includes an unknown item says so, because the real total could be higher.
What does ESTIMATED mean?
When a label leaves out potassium or phosphorus, you can borrow the value from a similar USDA food you choose. The borrowed number is marked ESTIMATED wherever it appears, including in your report.
Who sets my limits?
Your nephrologist or renal dietitian. During setup the app shows general published ranges, with their sources, as a starting point, and asks you to confirm them with your care team.
Does it work on dialysis?
Yes. It’s built for chronic kidney disease at any stage, including hemodialysis and peritoneal dialysis, and for caregivers who keep the log.
Does it need a connection?
No. All 13,694 foods and 434,111 barcodes are stored on the phone, so lookups work in a clinic basement or a dialysis unit with no signal. Only barcodes outside the USDA data are looked up on Open Food Facts, which needs a connection.
Is there an Android version?
Not yet. Kidney Compass is iPhone-only for now.
How do I cancel or restore a purchase?
To cancel, open iPhone Settings, tap your name, then Subscriptions. To restore, open the app and go to More, Settings, Restore purchases.
Is this medical advice?
No. Kidney Compass is a food lookup and diary. It is not a medical device and doesn’t diagnose or treat anything. Talk to your care team before changing your diet, fluids or medicines.